| 0 | 1 | 2 | 3 | 4 | 5 | 6 | 7 | 8 | |
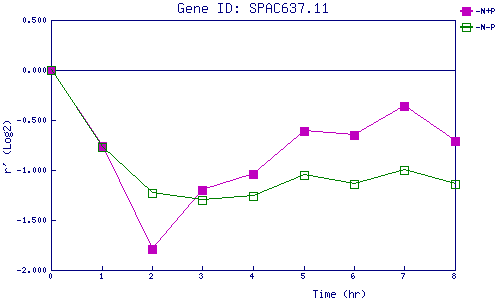
| -N+P | 0.000 | -0.761 | -1.789 | -1.201 | -1.038 | -0.611 | -0.653 | -0.364 | -0.709 |
| -N-P | 0.000 | -0.770 | -1.228 | -1.297 | -1.256 | -1.054 | -1.137 | -1.004 | -1.143 |
|
-N+P: Nitrogen starved in the presence of P-factor -N-P: Nitrogen starved in the absence of P-factor |