mst1
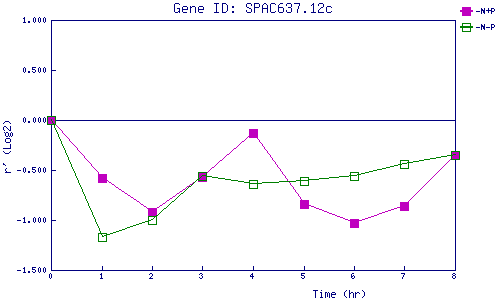
| 0 | 1 | 2 | 3 | 4 | 5 | 6 | 7 | 8 | |
| -N+P | 0.000 | -0.585 | -0.923 | -0.573 | -0.133 | -0.839 | -1.031 | -0.864 | -0.349 |
| -N-P | 0.000 | -1.172 | -1.005 | -0.565 | -0.644 | -0.607 | -0.564 | -0.440 | -0.350 |
|
-N+P: Nitrogen starved in the presence of P-factor -N-P: Nitrogen starved in the absence of P-factor |