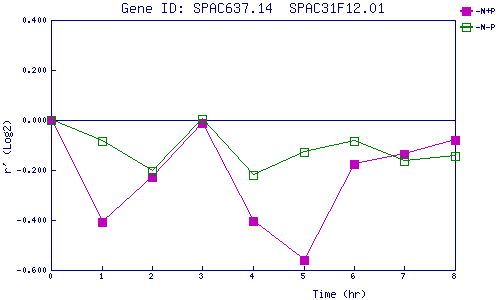
| 0 | 1 | 2 | 3 | 4 | 5 | 6 | 7 | 8 | |
| -N+P | 0.000 | -0.409 | -0.228 | -0.013 | -0.403 | -0.561 | -0.177 | -0.134 | -0.078 |
| -N-P | 0.000 | -0.085 | -0.205 | 0.003 | -0.221 | -0.128 | -0.084 | -0.165 | -0.142 |
|
-N+P: Nitrogen starved in the presence of P-factor -N-P: Nitrogen starved in the absence of P-factor |