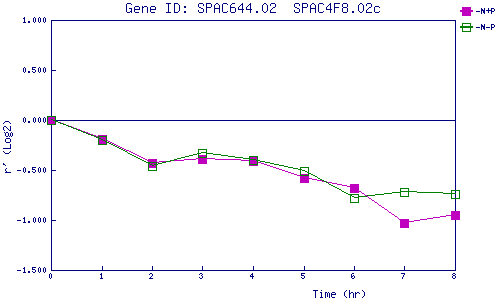
| 0 | 1 | 2 | 3 | 4 | 5 | 6 | 7 | 8 | |
| -N+P | 0.000 | -0.188 | -0.432 | -0.392 | -0.413 | -0.585 | -0.683 | -1.029 | -0.946 |
| -N-P | 0.000 | -0.197 | -0.463 | -0.327 | -0.404 | -0.512 | -0.779 | -0.724 | -0.737 |
|
-N+P: Nitrogen starved in the presence of P-factor -N-P: Nitrogen starved in the absence of P-factor |