pct1
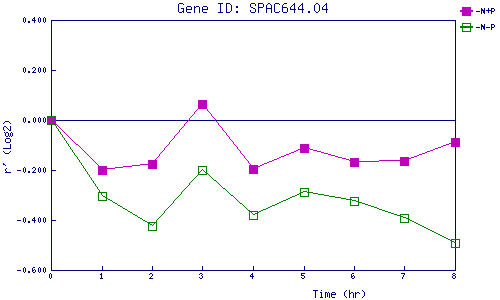
| 0 | 1 | 2 | 3 | 4 | 5 | 6 | 7 | 8 | |
| -N+P | 0.000 | -0.198 | -0.175 | 0.066 | -0.197 | -0.113 | -0.166 | -0.163 | -0.089 |
| -N-P | 0.000 | -0.303 | -0.425 | -0.201 | -0.381 | -0.287 | -0.325 | -0.391 | -0.493 |
|
-N+P: Nitrogen starved in the presence of P-factor -N-P: Nitrogen starved in the absence of P-factor |