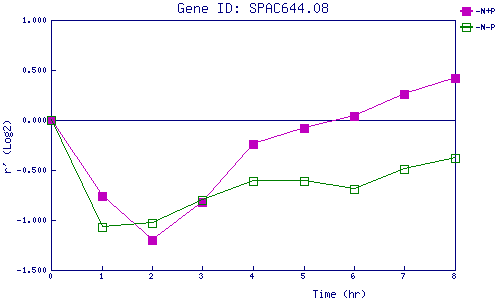
| 0 | 1 | 2 | 3 | 4 | 5 | 6 | 7 | 8 | |
| -N+P | 0.000 | -0.764 | -1.204 | -0.825 | -0.235 | -0.080 | 0.036 | 0.261 | 0.419 |
| -N-P | 0.000 | -1.069 | -1.032 | -0.796 | -0.611 | -0.611 | -0.689 | -0.492 | -0.379 |
|
-N+P: Nitrogen starved in the presence of P-factor -N-P: Nitrogen starved in the absence of P-factor |