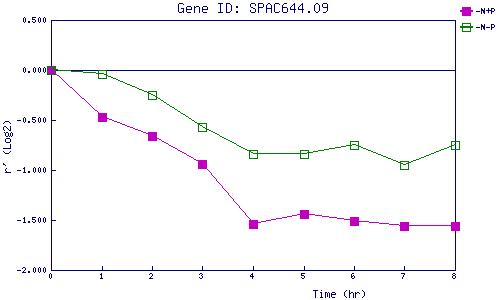
| 0 | 1 | 2 | 3 | 4 | 5 | 6 | 7 | 8 | |
| -N+P | 0.000 | -0.470 | -0.663 | -0.937 | -1.538 | -1.435 | -1.506 | -1.566 | -1.565 |
| -N-P | 0.000 | -0.040 | -0.252 | -0.567 | -0.840 | -0.843 | -0.746 | -0.947 | -0.750 |
|
-N+P: Nitrogen starved in the presence of P-factor -N-P: Nitrogen starved in the absence of P-factor |