cdc5
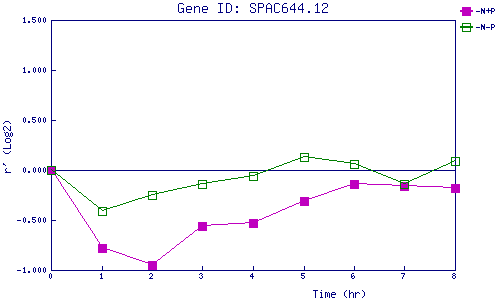
| 0 | 1 | 2 | 3 | 4 | 5 | 6 | 7 | 8 | |
| -N+P | 0.000 | -0.775 | -0.948 | -0.563 | -0.526 | -0.311 | -0.137 | -0.160 | -0.180 |
| -N-P | 0.000 | -0.410 | -0.253 | -0.140 | -0.057 | 0.133 | 0.059 | -0.135 | 0.087 |
|
-N+P: Nitrogen starved in the presence of P-factor -N-P: Nitrogen starved in the absence of P-factor |