rhp51 rad51
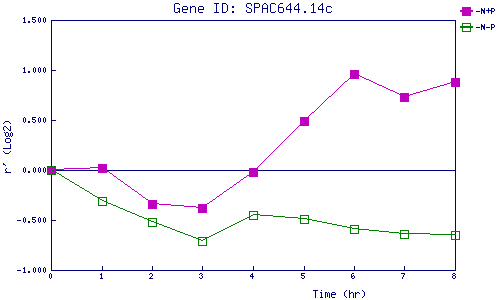
| 0 | 1 | 2 | 3 | 4 | 5 | 6 | 7 | 8 | |
| -N+P | 0.000 | 0.017 | -0.344 | -0.375 | -0.024 | 0.490 | 0.956 | 0.728 | 0.880 |
| -N-P | 0.000 | -0.307 | -0.520 | -0.711 | -0.450 | -0.489 | -0.590 | -0.642 | -0.650 |
|
-N+P: Nitrogen starved in the presence of P-factor -N-P: Nitrogen starved in the absence of P-factor |