rpp101 rpp1-1
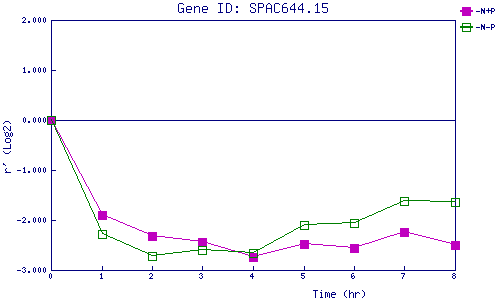
| 0 | 1 | 2 | 3 | 4 | 5 | 6 | 7 | 8 | |
| -N+P | 0.000 | -1.908 | -2.325 | -2.449 | -2.749 | -2.485 | -2.552 | -2.246 | -2.498 |
| -N-P | 0.000 | -2.288 | -2.730 | -2.595 | -2.652 | -2.106 | -2.062 | -1.627 | -1.640 |
|
-N+P: Nitrogen starved in the presence of P-factor -N-P: Nitrogen starved in the absence of P-factor |