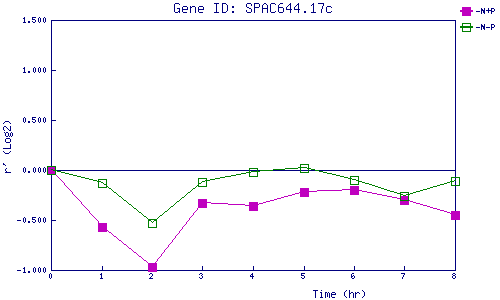
| 0 | 1 | 2 | 3 | 4 | 5 | 6 | 7 | 8 | |
| -N+P | 0.000 | -0.571 | -0.968 | -0.332 | -0.355 | -0.222 | -0.198 | -0.300 | -0.453 |
| -N-P | 0.000 | -0.130 | -0.532 | -0.122 | -0.021 | 0.015 | -0.096 | -0.264 | -0.107 |
|
-N+P: Nitrogen starved in the presence of P-factor -N-P: Nitrogen starved in the absence of P-factor |