bet3
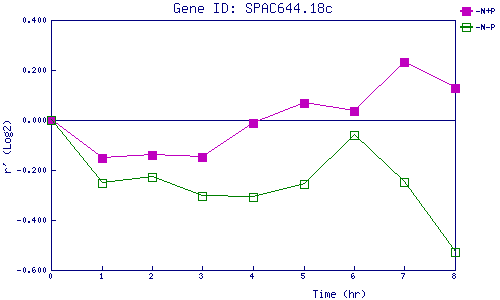
| 0 | 1 | 2 | 3 | 4 | 5 | 6 | 7 | 8 | |
| -N+P | 0.000 | -0.150 | -0.140 | -0.147 | -0.011 | 0.068 | 0.035 | 0.233 | 0.128 |
| -N-P | 0.000 | -0.252 | -0.227 | -0.303 | -0.307 | -0.257 | -0.059 | -0.250 | -0.530 |
|
-N+P: Nitrogen starved in the presence of P-factor -N-P: Nitrogen starved in the absence of P-factor |