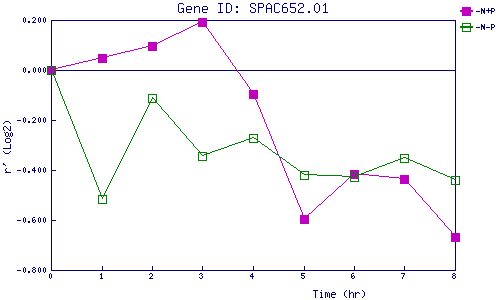
| 0 | 1 | 2 | 3 | 4 | 5 | 6 | 7 | 8 | |
| -N+P | 0.000 | 0.050 | 0.096 | 0.193 | -0.096 | -0.595 | -0.417 | -0.437 | -0.668 |
| -N-P | 0.000 | -0.516 | -0.111 | -0.343 | -0.273 | -0.419 | -0.427 | -0.350 | -0.441 |
|
-N+P: Nitrogen starved in the presence of P-factor -N-P: Nitrogen starved in the absence of P-factor |