swi6
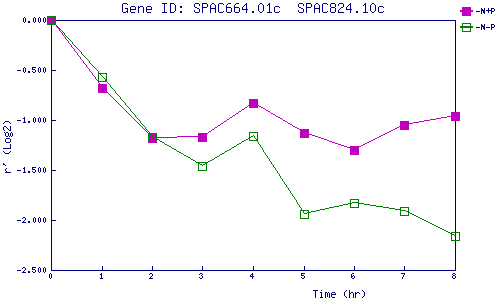
| 0 | 1 | 2 | 3 | 4 | 5 | 6 | 7 | 8 | |
| -N+P | 0.000 | -0.675 | -1.175 | -1.170 | -0.829 | -1.126 | -1.297 | -1.053 | -0.959 |
| -N-P | 0.000 | -0.570 | -1.174 | -1.455 | -1.158 | -1.937 | -1.834 | -1.912 | -2.165 |
|
-N+P: Nitrogen starved in the presence of P-factor -N-P: Nitrogen starved in the absence of P-factor |