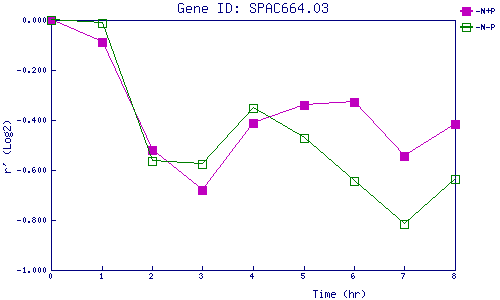
| 0 | 1 | 2 | 3 | 4 | 5 | 6 | 7 | 8 | |
| -N+P | 0.000 | -0.088 | -0.522 | -0.680 | -0.412 | -0.341 | -0.327 | -0.545 | -0.417 |
| -N-P | 0.000 | -0.013 | -0.565 | -0.575 | -0.354 | -0.471 | -0.644 | -0.817 | -0.636 |
|
-N+P: Nitrogen starved in the presence of P-factor -N-P: Nitrogen starved in the absence of P-factor |