rps16-2 rps1602 rps16
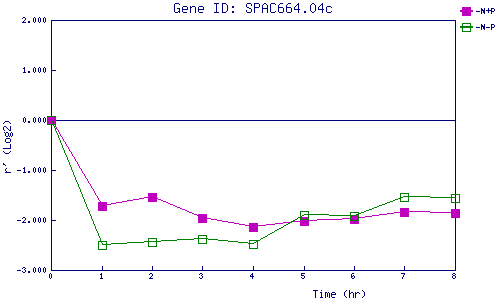
| 0 | 1 | 2 | 3 | 4 | 5 | 6 | 7 | 8 | |
| -N+P | 0.000 | -1.725 | -1.549 | -1.964 | -2.136 | -2.016 | -1.978 | -1.839 | -1.868 |
| -N-P | 0.000 | -2.506 | -2.430 | -2.385 | -2.474 | -1.907 | -1.918 | -1.544 | -1.566 |
|
-N+P: Nitrogen starved in the presence of P-factor -N-P: Nitrogen starved in the absence of P-factor |