rpl13
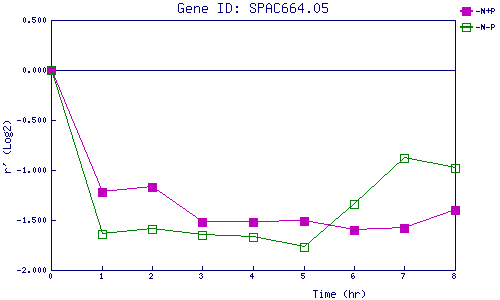
| 0 | 1 | 2 | 3 | 4 | 5 | 6 | 7 | 8 | |
| -N+P | 0.000 | -1.217 | -1.168 | -1.515 | -1.517 | -1.512 | -1.598 | -1.577 | -1.397 |
| -N-P | 0.000 | -1.639 | -1.588 | -1.650 | -1.668 | -1.766 | -1.335 | -0.875 | -0.980 |
|
-N+P: Nitrogen starved in the presence of P-factor -N-P: Nitrogen starved in the absence of P-factor |