rpl703 rpl7 rpl7-3
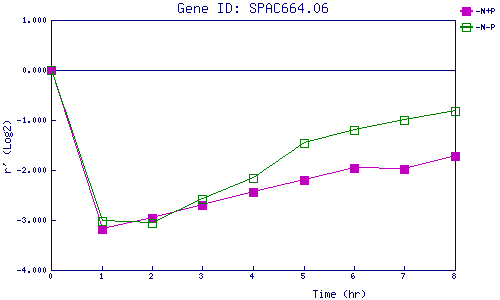
| 0 | 1 | 2 | 3 | 4 | 5 | 6 | 7 | 8 | |
| -N+P | 0.000 | -3.188 | -2.969 | -2.694 | -2.440 | -2.196 | -1.952 | -1.971 | -1.724 |
| -N-P | 0.000 | -3.023 | -3.060 | -2.584 | -2.154 | -1.452 | -1.209 | -1.001 | -0.814 |
|
-N+P: Nitrogen starved in the presence of P-factor -N-P: Nitrogen starved in the absence of P-factor |