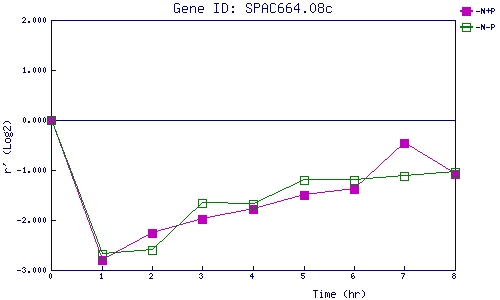
| 0 | 1 | 2 | 3 | 4 | 5 | 6 | 7 | 8 | |
| -N+P | 0.000 | -2.790 | -2.262 | -1.972 | -1.785 | -1.494 | -1.382 | -0.458 | -1.072 |
| -N-P | 0.000 | -2.674 | -2.595 | -1.668 | -1.674 | -1.196 | -1.200 | -1.124 | -1.047 |
|
-N+P: Nitrogen starved in the presence of P-factor -N-P: Nitrogen starved in the absence of P-factor |