| 0 | 1 | 2 | 3 | 4 | 5 | 6 | 7 | 8 | |
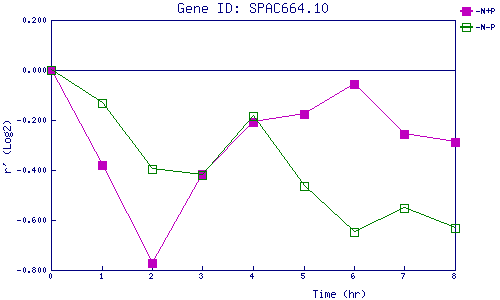
| -N+P | 0.000 | -0.379 | -0.771 | -0.416 | -0.209 | -0.176 | -0.055 | -0.258 | -0.286 |
| -N-P | 0.000 | -0.132 | -0.397 | -0.421 | -0.186 | -0.466 | -0.647 | -0.553 | -0.632 |
|
-N+P: Nitrogen starved in the presence of P-factor -N-P: Nitrogen starved in the absence of P-factor |