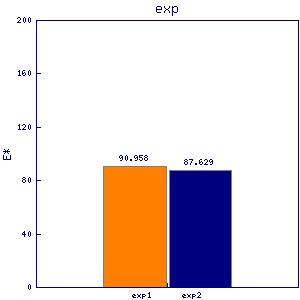
ssp1 ssc1
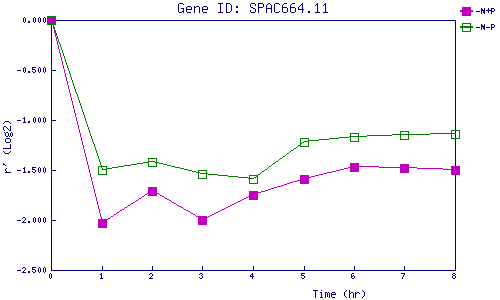
| 0 | 1 | 2 | 3 | 4 | 5 | 6 | 7 | 8 | |
| -N+P | 0.000 | -2.033 | -1.709 | -2.002 | -1.753 | -1.594 | -1.474 | -1.482 | -1.503 |
| -N-P | 0.000 | -1.501 | -1.424 | -1.540 | -1.590 | -1.217 | -1.169 | -1.150 | -1.143 |
|
-N+P: Nitrogen starved in the presence of P-factor -N-P: Nitrogen starved in the absence of P-factor |