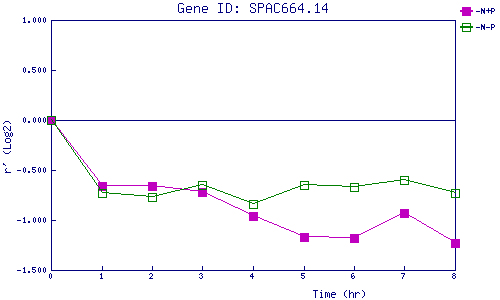
| 0 | 1 | 2 | 3 | 4 | 5 | 6 | 7 | 8 | |
| -N+P | 0.000 | -0.665 | -0.663 | -0.724 | -0.963 | -1.172 | -1.181 | -0.934 | -1.228 |
| -N-P | 0.000 | -0.727 | -0.771 | -0.650 | -0.844 | -0.654 | -0.673 | -0.598 | -0.731 |
|
-N+P: Nitrogen starved in the presence of P-factor -N-P: Nitrogen starved in the absence of P-factor |