| 0 | 1 | 2 | 3 | 4 | 5 | 6 | 7 | 8 | |
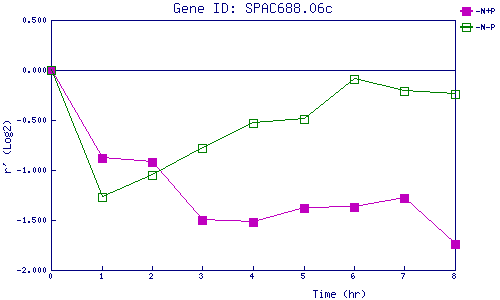
| -N+P | 0.000 | -0.885 | -0.918 | -1.497 | -1.516 | -1.381 | -1.368 | -1.278 | -1.743 |
| -N-P | 0.000 | -1.274 | -1.048 | -0.784 | -0.526 | -0.488 | -0.091 | -0.206 | -0.245 |
|
-N+P: Nitrogen starved in the presence of P-factor -N-P: Nitrogen starved in the absence of P-factor |