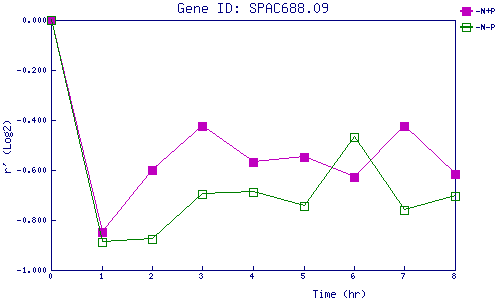
| 0 | 1 | 2 | 3 | 4 | 5 | 6 | 7 | 8 | |
| -N+P | 0.000 | -0.849 | -0.602 | -0.425 | -0.569 | -0.548 | -0.627 | -0.424 | -0.614 |
| -N-P | 0.000 | -0.886 | -0.877 | -0.694 | -0.690 | -0.742 | -0.469 | -0.758 | -0.705 |
|
-N+P: Nitrogen starved in the presence of P-factor -N-P: Nitrogen starved in the absence of P-factor |