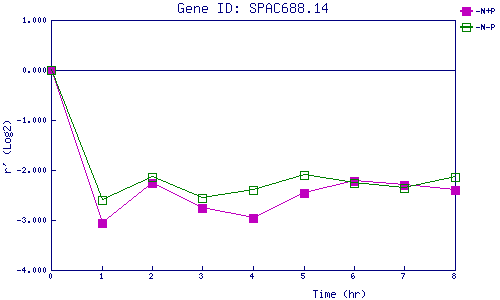
| 0 | 1 | 2 | 3 | 4 | 5 | 6 | 7 | 8 | |
| -N+P | 0.000 | -3.054 | -2.259 | -2.764 | -2.956 | -2.453 | -2.225 | -2.304 | -2.398 |
| -N-P | 0.000 | -2.611 | -2.149 | -2.554 | -2.402 | -2.105 | -2.261 | -2.363 | -2.137 |
|
-N+P: Nitrogen starved in the presence of P-factor -N-P: Nitrogen starved in the absence of P-factor |