| 0 | 1 | 2 | 3 | 4 | 5 | 6 | 7 | 8 | |
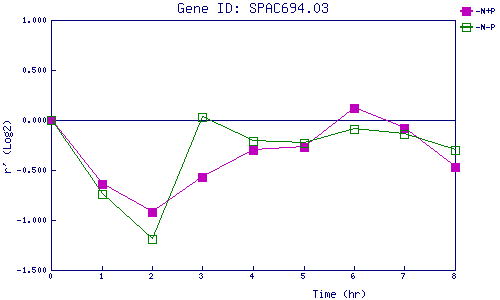
| -N+P | 0.000 | -0.638 | -0.924 | -0.567 | -0.304 | -0.273 | 0.121 | -0.077 | -0.467 |
| -N-P | 0.000 | -0.740 | -1.186 | 0.034 | -0.210 | -0.232 | -0.092 | -0.135 | -0.304 |
|
-N+P: Nitrogen starved in the presence of P-factor -N-P: Nitrogen starved in the absence of P-factor |