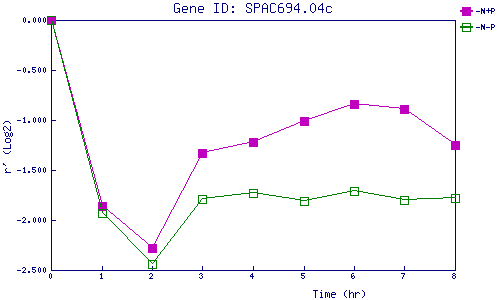
| 0 | 1 | 2 | 3 | 4 | 5 | 6 | 7 | 8 | |
| -N+P | 0.000 | -1.864 | -2.284 | -1.334 | -1.221 | -1.009 | -0.838 | -0.887 | -1.250 |
| -N-P | 0.000 | -1.932 | -2.442 | -1.794 | -1.731 | -1.812 | -1.712 | -1.799 | -1.781 |
|
-N+P: Nitrogen starved in the presence of P-factor -N-P: Nitrogen starved in the absence of P-factor |