| 0 | 1 | 2 | 3 | 4 | 5 | 6 | 7 | 8 | |
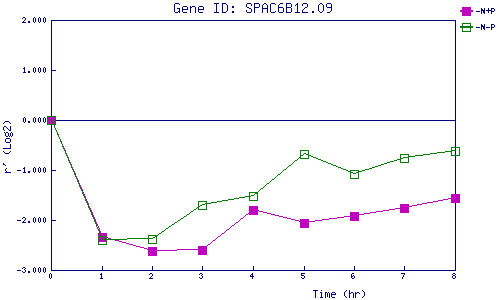
| -N+P | 0.000 | -2.334 | -2.621 | -2.596 | -1.793 | -2.062 | -1.930 | -1.760 | -1.556 |
| -N-P | 0.000 | -2.399 | -2.386 | -1.705 | -1.524 | -0.672 | -1.090 | -0.757 | -0.628 |
|
-N+P: Nitrogen starved in the presence of P-factor -N-P: Nitrogen starved in the absence of P-factor |