pri1 spp1
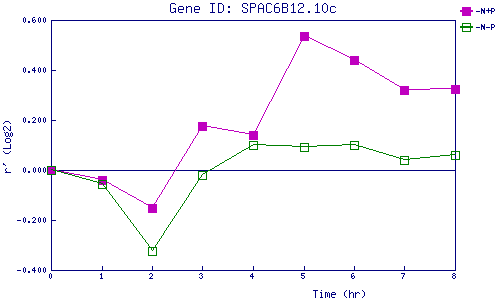
| 0 | 1 | 2 | 3 | 4 | 5 | 6 | 7 | 8 | |
| -N+P | 0.000 | -0.042 | -0.153 | 0.174 | 0.140 | 0.538 | 0.440 | 0.320 | 0.323 |
| -N-P | 0.000 | -0.055 | -0.325 | -0.021 | 0.101 | 0.092 | 0.100 | 0.042 | 0.059 |
|
-N+P: Nitrogen starved in the presence of P-factor -N-P: Nitrogen starved in the absence of P-factor |