prl43
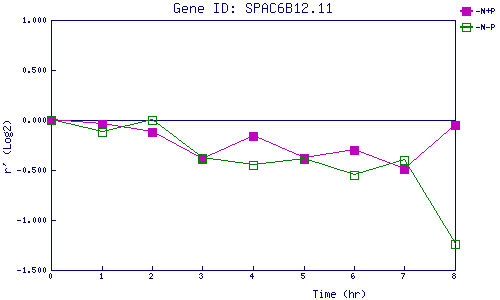
| 0 | 1 | 2 | 3 | 4 | 5 | 6 | 7 | 8 | |
| -N+P | 0.000 | -0.044 | -0.123 | -0.394 | -0.159 | -0.382 | -0.303 | -0.490 | -0.049 |
| -N-P | 0.000 | -0.123 | 0.002 | -0.377 | -0.452 | -0.394 | -0.549 | -0.400 | -1.242 |
|
-N+P: Nitrogen starved in the presence of P-factor -N-P: Nitrogen starved in the absence of P-factor |