tom70
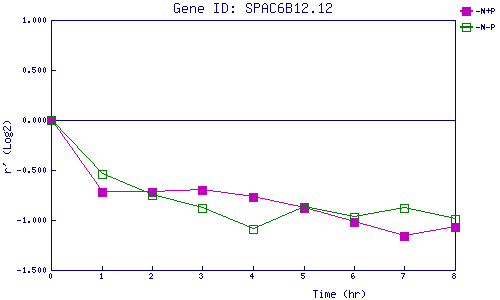
| 0 | 1 | 2 | 3 | 4 | 5 | 6 | 7 | 8 | |
| -N+P | 0.000 | -0.724 | -0.718 | -0.699 | -0.768 | -0.885 | -1.022 | -1.158 | -1.070 |
| -N-P | 0.000 | -0.542 | -0.754 | -0.877 | -1.090 | -0.868 | -0.970 | -0.883 | -0.988 |
|
-N+P: Nitrogen starved in the presence of P-factor -N-P: Nitrogen starved in the absence of P-factor |