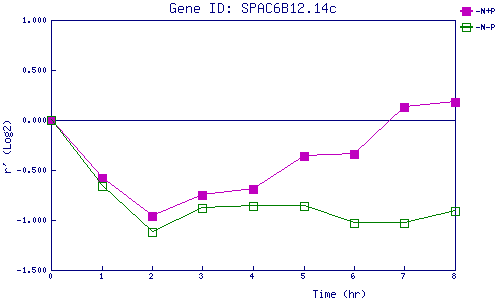
| 0 | 1 | 2 | 3 | 4 | 5 | 6 | 7 | 8 | |
| -N+P | 0.000 | -0.582 | -0.964 | -0.748 | -0.689 | -0.365 | -0.342 | 0.132 | 0.175 |
| -N-P | 0.000 | -0.656 | -1.121 | -0.883 | -0.864 | -0.860 | -1.031 | -1.031 | -0.912 |
|
-N+P: Nitrogen starved in the presence of P-factor -N-P: Nitrogen starved in the absence of P-factor |