cpc2 rkp1
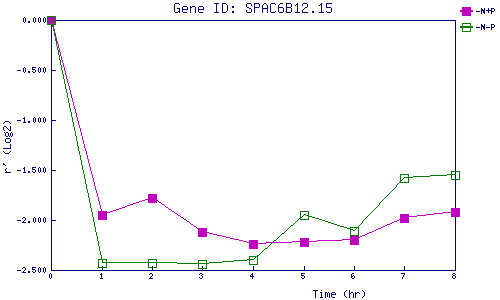
| 0 | 1 | 2 | 3 | 4 | 5 | 6 | 7 | 8 | |
| -N+P | 0.000 | -1.950 | -1.784 | -2.118 | -2.243 | -2.220 | -2.198 | -1.978 | -1.916 |
| -N-P | 0.000 | -2.434 | -2.431 | -2.444 | -2.400 | -1.954 | -2.108 | -1.579 | -1.553 |
|
-N+P: Nitrogen starved in the presence of P-factor -N-P: Nitrogen starved in the absence of P-factor |