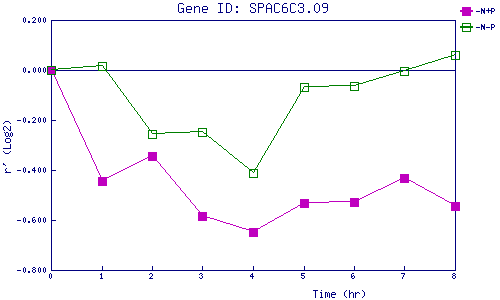
| 0 | 1 | 2 | 3 | 4 | 5 | 6 | 7 | 8 | |
| -N+P | 0.000 | -0.445 | -0.345 | -0.582 | -0.648 | -0.533 | -0.526 | -0.432 | -0.543 |
| -N-P | 0.000 | 0.014 | -0.255 | -0.247 | -0.411 | -0.068 | -0.064 | -0.004 | 0.060 |
|
-N+P: Nitrogen starved in the presence of P-factor -N-P: Nitrogen starved in the absence of P-factor |