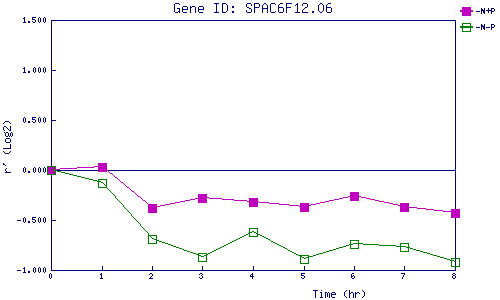
| 0 | 1 | 2 | 3 | 4 | 5 | 6 | 7 | 8 | |
| -N+P | 0.000 | 0.034 | -0.380 | -0.279 | -0.322 | -0.374 | -0.257 | -0.366 | -0.432 |
| -N-P | 0.000 | -0.126 | -0.692 | -0.871 | -0.620 | -0.893 | -0.744 | -0.772 | -0.921 |
|
-N+P: Nitrogen starved in the presence of P-factor -N-P: Nitrogen starved in the absence of P-factor |