tom20
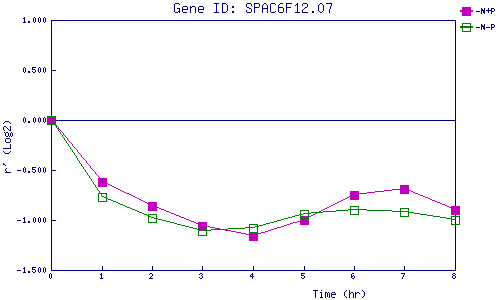
| 0 | 1 | 2 | 3 | 4 | 5 | 6 | 7 | 8 | |
| -N+P | 0.000 | -0.619 | -0.863 | -1.057 | -1.159 | -0.997 | -0.754 | -0.686 | -0.900 |
| -N-P | 0.000 | -0.773 | -0.983 | -1.113 | -1.083 | -0.944 | -0.903 | -0.917 | -1.001 |
|
-N+P: Nitrogen starved in the presence of P-factor -N-P: Nitrogen starved in the absence of P-factor |