ade3 min11
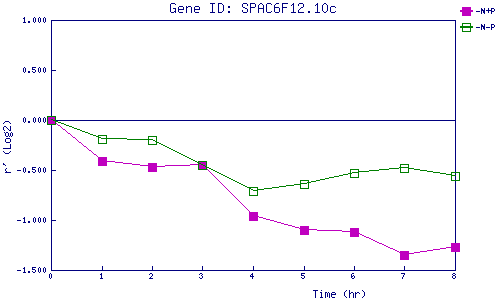
| 0 | 1 | 2 | 3 | 4 | 5 | 6 | 7 | 8 | |
| -N+P | 0.000 | -0.414 | -0.470 | -0.447 | -0.965 | -1.097 | -1.124 | -1.347 | -1.271 |
| -N-P | 0.000 | -0.186 | -0.199 | -0.448 | -0.714 | -0.644 | -0.526 | -0.477 | -0.563 |
|
-N+P: Nitrogen starved in the presence of P-factor -N-P: Nitrogen starved in the absence of P-factor |