sfc1
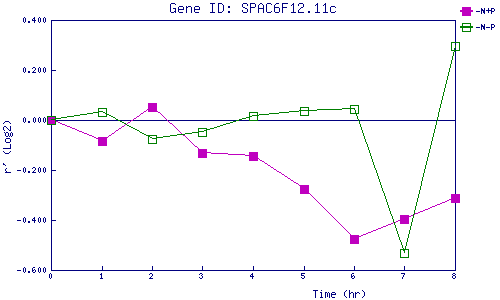
| 0 | 1 | 2 | 3 | 4 | 5 | 6 | 7 | 8 | |
| -N+P | 0.000 | -0.083 | 0.053 | -0.133 | -0.145 | -0.276 | -0.477 | -0.395 | -0.311 |
| -N-P | 0.000 | 0.030 | -0.077 | -0.048 | 0.018 | 0.035 | 0.043 | -0.533 | 0.298 |
|
-N+P: Nitrogen starved in the presence of P-factor -N-P: Nitrogen starved in the absence of P-factor |