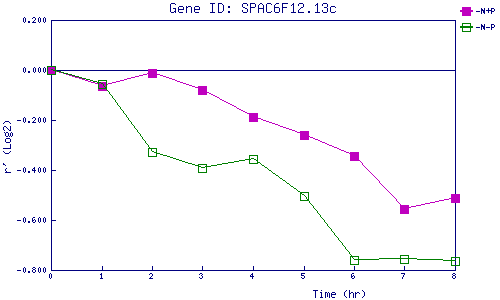
| 0 | 1 | 2 | 3 | 4 | 5 | 6 | 7 | 8 | |
| -N+P | 0.000 | -0.065 | -0.011 | -0.079 | -0.189 | -0.260 | -0.346 | -0.557 | -0.512 |
| -N-P | 0.000 | -0.054 | -0.330 | -0.394 | -0.357 | -0.503 | -0.760 | -0.755 | -0.765 |
|
-N+P: Nitrogen starved in the presence of P-factor -N-P: Nitrogen starved in the absence of P-factor |