| 0 | 1 | 2 | 3 | 4 | 5 | 6 | 7 | 8 | |
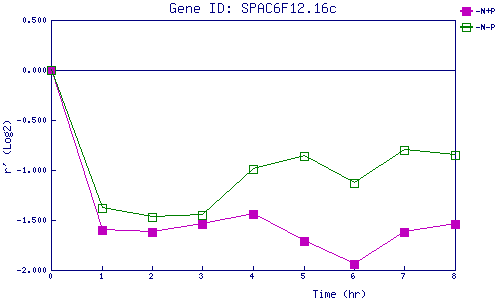
| -N+P | 0.000 | -1.601 | -1.625 | -1.544 | -1.436 | -1.708 | -1.939 | -1.623 | -1.543 |
| -N-P | 0.000 | -1.378 | -1.467 | -1.450 | -0.991 | -0.857 | -1.127 | -0.799 | -0.851 |
|
-N+P: Nitrogen starved in the presence of P-factor -N-P: Nitrogen starved in the absence of P-factor |