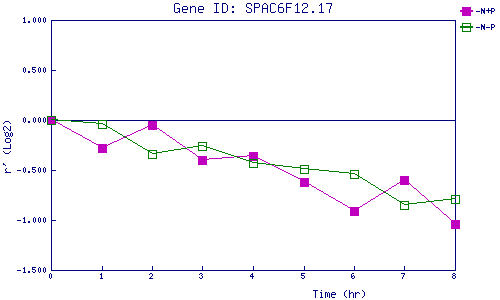
| 0 | 1 | 2 | 3 | 4 | 5 | 6 | 7 | 8 | |
| -N+P | 0.000 | -0.281 | -0.047 | -0.398 | -0.355 | -0.623 | -0.907 | -0.596 | -1.040 |
| -N-P | 0.000 | -0.037 | -0.343 | -0.258 | -0.434 | -0.486 | -0.544 | -0.850 | -0.791 |
|
-N+P: Nitrogen starved in the presence of P-factor -N-P: Nitrogen starved in the absence of P-factor |