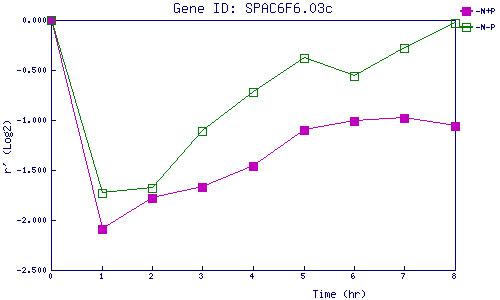
| 0 | 1 | 2 | 3 | 4 | 5 | 6 | 7 | 8 | |
| -N+P | 0.000 | -2.086 | -1.785 | -1.667 | -1.456 | -1.105 | -1.014 | -0.977 | -1.062 |
| -N-P | 0.000 | -1.728 | -1.679 | -1.107 | -0.721 | -0.376 | -0.555 | -0.281 | -0.032 |
|
-N+P: Nitrogen starved in the presence of P-factor -N-P: Nitrogen starved in the absence of P-factor |