| 0 | 1 | 2 | 3 | 4 | 5 | 6 | 7 | 8 | |
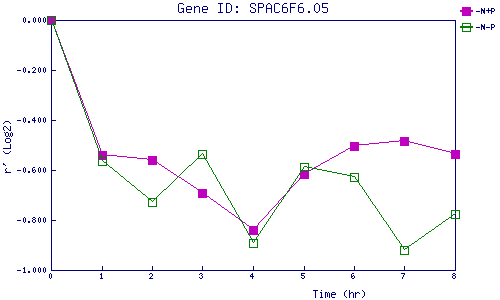
| -N+P | 0.000 | -0.541 | -0.559 | -0.692 | -0.842 | -0.618 | -0.503 | -0.485 | -0.535 |
| -N-P | 0.000 | -0.564 | -0.729 | -0.535 | -0.892 | -0.588 | -0.629 | -0.919 | -0.775 |
|
-N+P: Nitrogen starved in the presence of P-factor -N-P: Nitrogen starved in the absence of P-factor |