rps13
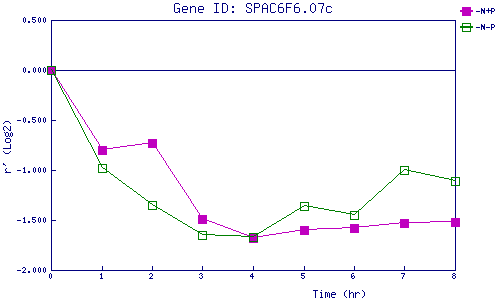
| 0 | 1 | 2 | 3 | 4 | 5 | 6 | 7 | 8 | |
| -N+P | 0.000 | -0.805 | -0.731 | -1.494 | -1.684 | -1.601 | -1.585 | -1.527 | -1.525 |
| -N-P | 0.000 | -0.985 | -1.351 | -1.650 | -1.672 | -1.356 | -1.452 | -1.005 | -1.108 |
|
-N+P: Nitrogen starved in the presence of P-factor -N-P: Nitrogen starved in the absence of P-factor |