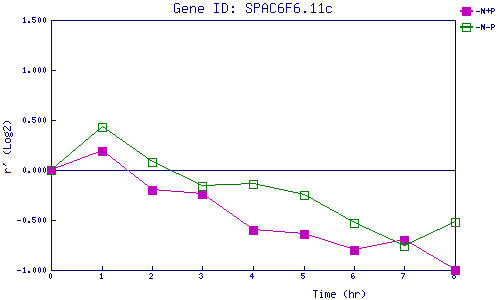
| 0 | 1 | 2 | 3 | 4 | 5 | 6 | 7 | 8 | |
| -N+P | 0.000 | 0.194 | -0.205 | -0.239 | -0.595 | -0.639 | -0.797 | -0.705 | -0.996 |
| -N-P | 0.000 | 0.432 | 0.076 | -0.162 | -0.144 | -0.254 | -0.534 | -0.755 | -0.519 |
|
-N+P: Nitrogen starved in the presence of P-factor -N-P: Nitrogen starved in the absence of P-factor |