| 0 | 1 | 2 | 3 | 4 | 5 | 6 | 7 | 8 | |
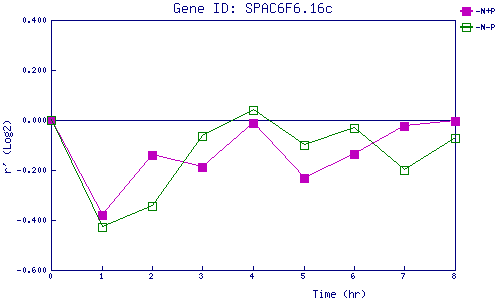
| -N+P | 0.000 | -0.381 | -0.140 | -0.188 | -0.013 | -0.233 | -0.134 | -0.025 | -0.003 |
| -N-P | 0.000 | -0.428 | -0.345 | -0.065 | 0.038 | -0.100 | -0.034 | -0.198 | -0.073 |
|
-N+P: Nitrogen starved in the presence of P-factor -N-P: Nitrogen starved in the absence of P-factor |