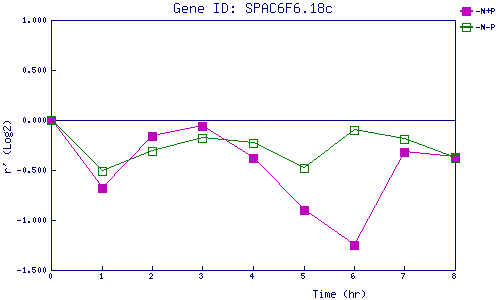
| 0 | 1 | 2 | 3 | 4 | 5 | 6 | 7 | 8 | |
| -N+P | 0.000 | -0.676 | -0.163 | -0.058 | -0.380 | -0.898 | -1.246 | -0.317 | -0.369 |
| -N-P | 0.000 | -0.510 | -0.314 | -0.177 | -0.232 | -0.483 | -0.098 | -0.189 | -0.383 |
|
-N+P: Nitrogen starved in the presence of P-factor -N-P: Nitrogen starved in the absence of P-factor |