thi1 ntf1
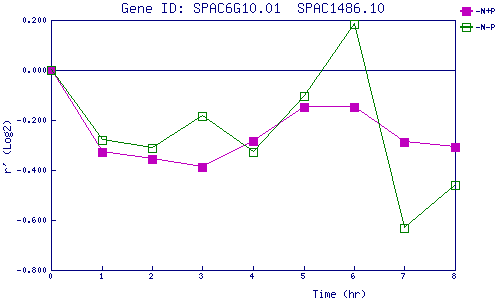
| 0 | 1 | 2 | 3 | 4 | 5 | 6 | 7 | 8 | |
| -N+P | 0.000 | -0.330 | -0.356 | -0.388 | -0.283 | -0.149 | -0.147 | -0.289 | -0.308 |
| -N-P | 0.000 | -0.282 | -0.311 | -0.186 | -0.329 | -0.102 | 0.185 | -0.633 | -0.461 |
|
-N+P: Nitrogen starved in the presence of P-factor -N-P: Nitrogen starved in the absence of P-factor |