tea3
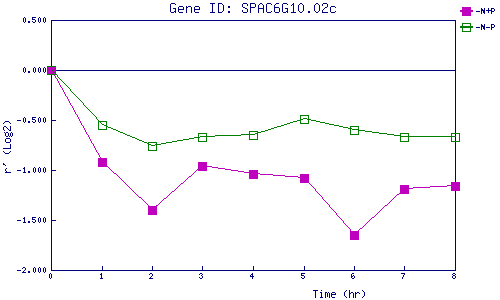
| 0 | 1 | 2 | 3 | 4 | 5 | 6 | 7 | 8 | |
| -N+P | 0.000 | -0.921 | -1.404 | -0.955 | -1.042 | -1.077 | -1.654 | -1.186 | -1.163 |
| -N-P | 0.000 | -0.551 | -0.755 | -0.671 | -0.646 | -0.486 | -0.601 | -0.674 | -0.669 |
|
-N+P: Nitrogen starved in the presence of P-factor -N-P: Nitrogen starved in the absence of P-factor |