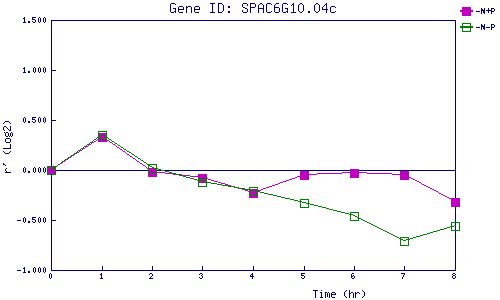
| 0 | 1 | 2 | 3 | 4 | 5 | 6 | 7 | 8 | |
| -N+P | 0.000 | 0.332 | -0.016 | -0.085 | -0.230 | -0.050 | -0.033 | -0.048 | -0.321 |
| -N-P | 0.000 | 0.351 | 0.019 | -0.123 | -0.214 | -0.332 | -0.455 | -0.713 | -0.560 |
|
-N+P: Nitrogen starved in the presence of P-factor -N-P: Nitrogen starved in the absence of P-factor |